Log Files
Log Browser assists you in troubleshooting issues with your websites by parsing the web server logs and displaying relevant warnings and error messages in the Plesk interface.
On Linux, the information from the following log files is displayed by default:
- Apache access (access_log). This log records all HTTP requests processed by the Apache web server.
- Apache ssl access (access_ssl_log). This log records all HTTPS requests processed by the Apache web server.
- Apache error (error_log). This log contains diagnostic information. It also records any errors that the Apache web server encounters in processing requests.
- nginx access (proxy_access_log). This log records all HTTP requests processed by the nginx proxy web server.
- nginx ssl access (proxy_access_ssl_log). This log records all HTTPS requests processed by the nginx proxy web server.
- nginx error (proxy_error_log). This log contains diagnostic information. It also records any errors that the nginx proxy web server encounters in processing requests.
On Windows, the information from the IIS log is displayed. This log records all requests processed by the web server, both HTTP and HTTPS, as well as any errors that the web server encounters in processing requests..
In addition, you can add any custom log file from you web site directory to track it in the Log Browser, as described below.
Access Log Browser
To access the Log Browser, go to Websites and Domains > Logs. You will be presented with a list of messages gathered from the logs. By default, the Log Browser displays messages present in the monitored logs at the moment of opening. If you want to refresh the list with messages added after opening the Log Browser, click Refresh. Alternatively, if you want to have new messages continuously added to the list, click Start real-time updates.
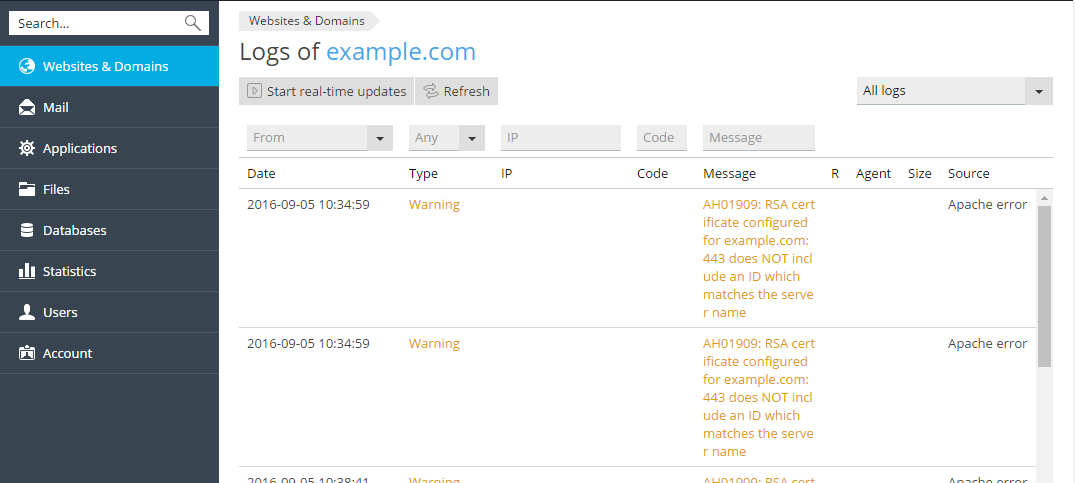
To select the logs from which you want to view messages, click the

Manage Log Files
To view all the messages in a log, go to Websites and Domains >
Logs > click the 
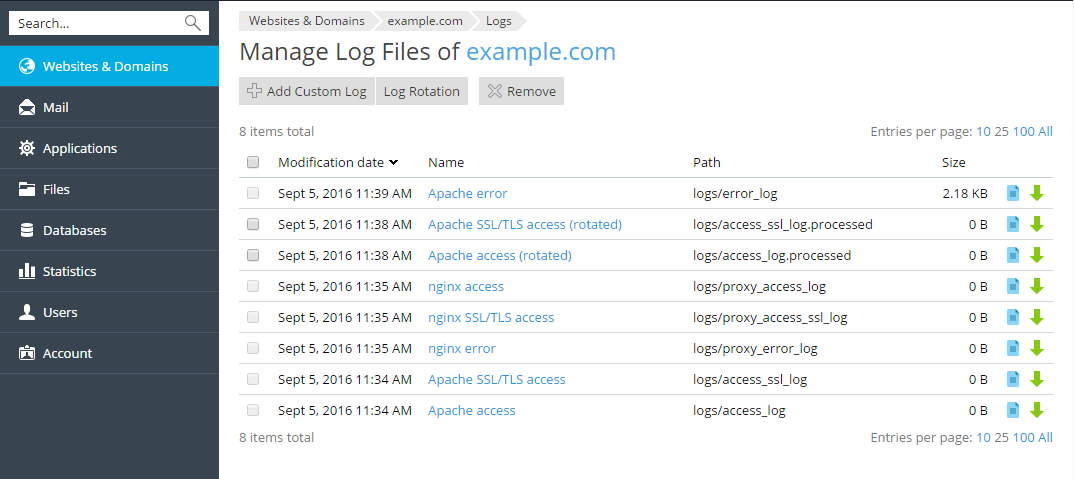
Here you can click a log file name to view the file content directly in
the Log Browser. You can click the 

To save disk space, you can enable log rotation that is automatic
compressing and/or deleting outdated website log files. To set up log
rotation, go to Websites and Domains > Logs > click the

You can delete log files that have been rotated (log files that have not yet been rotated cannot be removed).
Add a Custom Log File
You can add any custom log file from you web site directory to track its changes in the Log Browser. To do this, click the Add Custom Log button on the Manage Log Files page. The tree with your web site folders will be displayed. Select the file that you want to add to the Log Browser and click OK.
Note: Only plain text files can be selected. In order to be properly displayed, your custom log file should have timestamps for each log entry, otherwise it will not be parsed correctly.
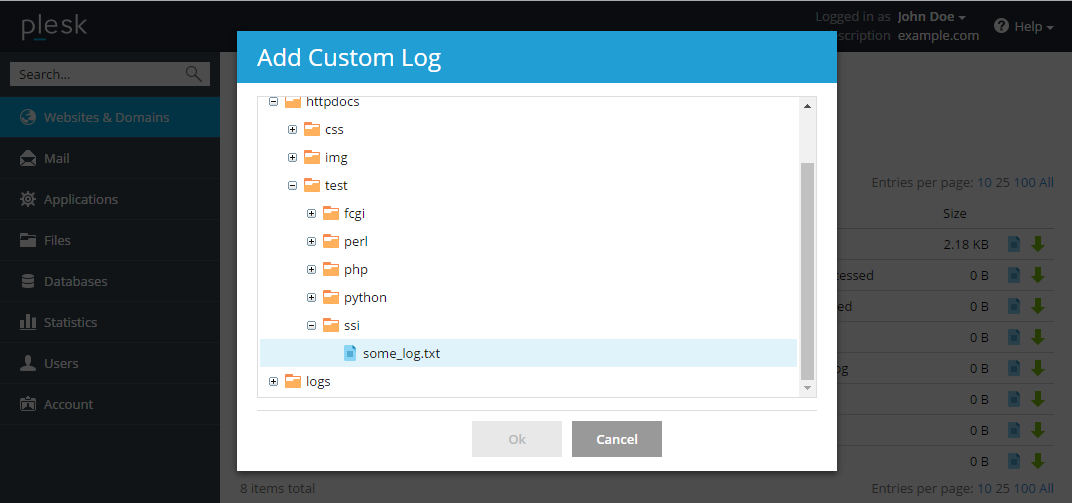
As a result, the selected log file will be displayed in the list of managed log files.
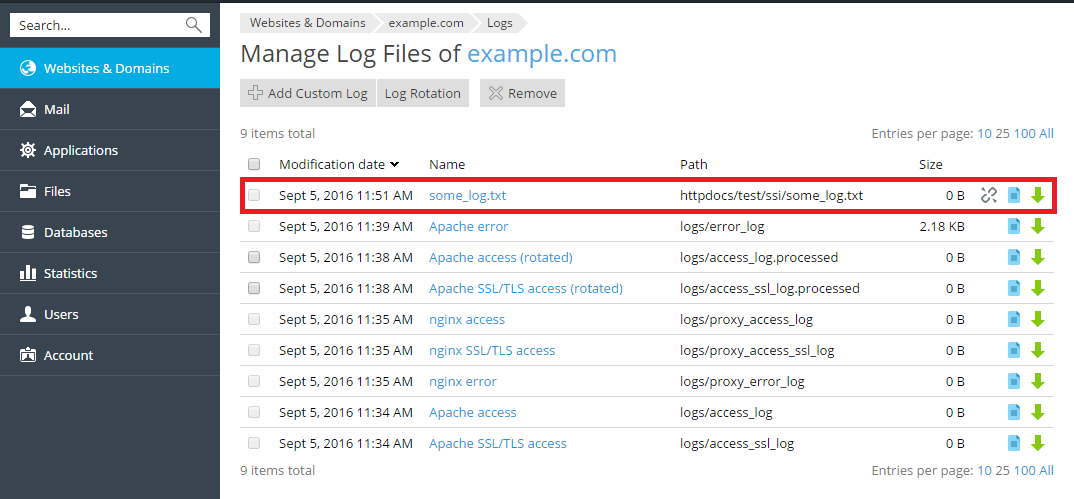
If you no longer want to monitor this custom log file, click
the 
You can also open a text file in the Log Browser directly from the File Manager, using the Open in Log Browser option.
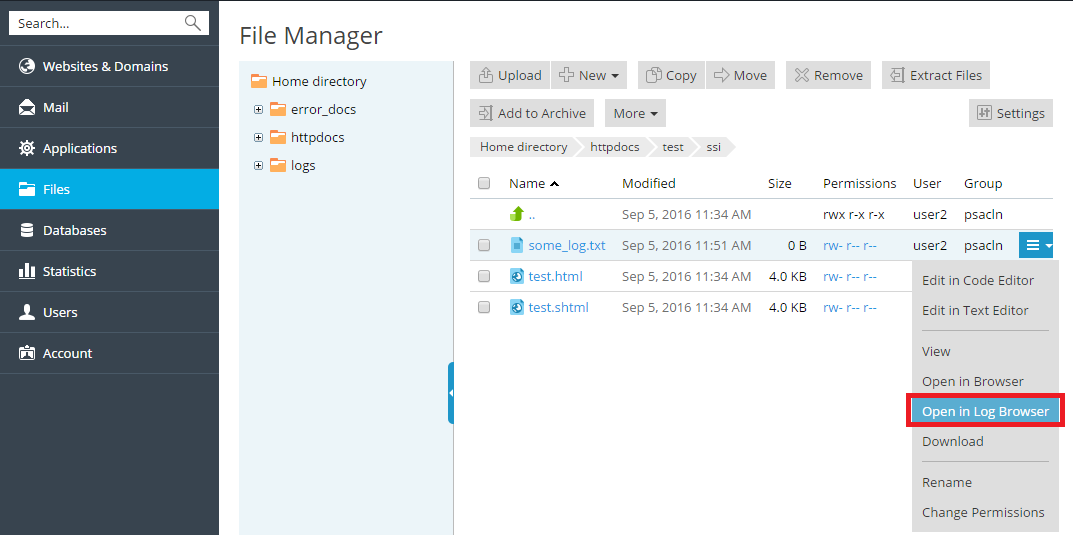
When you open a log file from the File Manager in the Log Browser, it is not yet added to the list of logs viewed in the Log Browser on a permanent basis. To add the file to the Log Browser, click the Add to Log Browser as Custom file button.

Note: Log rotation is not available for custom log files.